Hii users
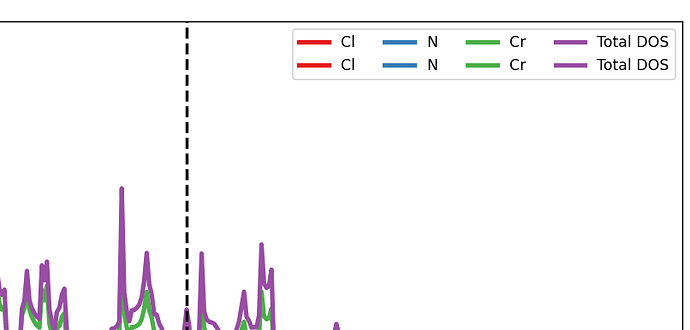
I have a script attached below. Here plt is a matplotlib Axes object. I want to change legend horizontally for that i
Image may be NSFW.
Clik here to view.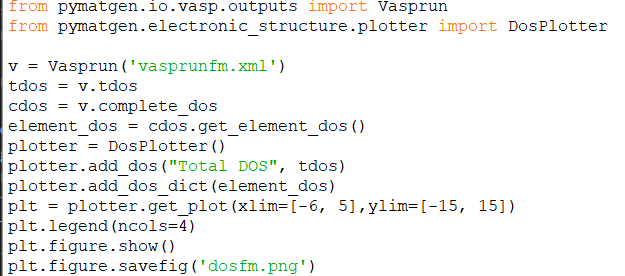
use ncols but now i am getting two legends in my plot. Anyone please help me what am i doing wrong.
1 post - 1 participant
